|
| |
Histograms in Excel with VBA macros
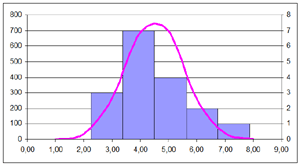
On this page I show how to make a histogram fast and easy in Excel with VBA macro code. I also show how to make a bell shaped curve with normal distribution and the same standard deviation and mean value as the histogram. A histogram is a graphical representation of data distribution. It could be the population's age distribution or quality data, and from the shape you get a pretty good idea if it is a normal distribution or not. To be sure about the normal distribution-thing you need to test statistically, but I'll leave that to you - this is about VBA! You can make histograms manually, if you have installed Analysis Toolpak, but it is tedious work (see a guide here) - it is much, much faster to use macros. In the first example I show how to make a histogram with a bell shaped curve like in Microsoft's example (like the image at the top), and you don't need Analysis Toolpak. The second example shows how to make a histogram with a user defined number of columns. The macro calculates interval size, counts frequencies and makes the histogram chart. You can copy the code and paste it into a VBA module, but it is easier to download the zipped workbook with the code. It also contains a simple userform, which is only referred to on this page. The VBA code on this page assumes that the source data for the histogram is in another workbook, and the histogram will be put on a new sheet in that workbook. Histogram with bell shaped curveIn the first histogram the chart's number of columns (intervals) is fixed to 8 and the interval size is the data's standard deviation. To make the bell shaped curve we use 2000 "random" numbers with the same standard deviation and mean value as the data for the histogram. The trick in doing this (getting the same standard deviation etc.) is to use the worksheet function "NormInv" together with VBA's random numbers generator, "Rnd". You'll se how later, when we get to the procedure "RandomNumbers". At module level you need to declare 2 public variables: Public bAbort as Boolean and Public bBell as Boolean Sub BellShape() 'The start procedure that calls the 'procedure "OpenForm". 'bAbort and bBell are Boolean variables 'declared on module level. bBell = True OpenForm If bAbort Then bAbort = False Exit Sub End If End Sub '**************************** Sub OpenForm() 'Opens the workbook containing source 'values or asks the user to do so. 'This procedure is used in making both 'types of histograms. On Error GoTo ErrorHandle 'If there is only one workbook open '(this one), we show a file open dialogue. If Workbooks.Count = 1 Then 'Open file dialogue With Application.FileDialog(msoFileDialogOpen) .Title = "Open workbook with values for histogram" 'Allow only one file to be opened .AllowMultiSelect = False 'Show files with the extension "xl*" .Filters.Add "Workbooks", "*.xl*", 1 .Show If .SelectedItems.Count > 0 Then Workbooks.Open (.SelectedItems(1)) Else 'If the user cancelled bAbort = True Exit Sub End If End With ElseIf Workbooks.Count = 2 Then 'If there are 2 open workbooks 'we activate the other one. If Workbooks.Item(1).Name = ThisWorkbook.Name Then Workbooks(2).Activate Else Workbooks(1).Activate End If ElseIf Workbooks.Count > 2 Then Workbooks(Workbooks.Count).Activate End If 'frmPickSheet is just a simple userform asking the user 'to activate the workbook with the source data - see 'the workbook download. frmPickSheet.Show vbModeless Exit Sub ErrorHandle: MsgBox Err.Description & " Procedure OpenForm" End Sub '**************************** 'Make a simple Userform with a label and 2 command buttons. 'Name it "frmPickSheet". 'The label should ask the user to select the sheet with 'source data, and it should have the following code: Private Sub CommandButton1_Click() Unload Me If bBell Then Module1.Histogram2 Else Module1.Histogram End If End Sub Private Sub CommandButton2_Click() Unload Me End Sub '**************************** Sub Histogram2() 'Makes a histogram and a bell shaped curve 'with normal distribution. The curve shape 'and interval size of the histogram are based 'on the data set's mean value and standard deviation. Dim bOK As Boolean Dim dAvg As Double 'Average Dim dStdev As Double 'Standard deviation Dim dStep As Double 'Interval size Dim dMax As Double 'Highest interval value Dim dRangeMax As Double 'Upper limit - actual max + 1 Dim dMin As Double 'Lowest value Dim lCount As Long 'Counter Dim lLast As Long 'Counter Dim rCell As Range 'Range variable Dim rInput As Range 'Range variable Dim rBell As Range 'Range variable Dim arData(1 To 8) 'Array for frequencies Dim arBackup() 'Array with unsorted input values Dim arIntervals(1 To 8, 1 To 2) 'Array for the intervals On Error Resume Next 'The user must select the first cell with a value 'in the column with values for the histogram. Set rInput = Application.InputBox _ (prompt:="Select the first cell with a value in " & _ "the column with values for the histogram.", Type:=8) If rInput Is Nothing Then Exit Sub On Error GoTo ErrorHandle 'Check: With rInput 'If there is more than 1 cell If .Count > 1 Then MsgBox "Please select only 1 cell." ThisWorkbook.Activate GoTo BeforeExit End If 'Check if it is empty If Len(.Value) = 0 Then MsgBox "The cell is empty." GoTo BeforeExit End If 'Numeric value? If IsNumeric(.Value) = False Then If IsNumeric(.Offset(1, 0)) = False Then MsgBox "It must be a number" ThisWorkbook.Activate GoTo BeforeExit Else 'If the cell below is numeric, the 'user probably selected the header. 'In that case we set rInput = the 'cell below. Set rInput = rInput.Offset(1, 0) End If End If 'Are there more than 1 cell with values? If IsEmpty(.Offset(1, 0)) Then MsgBox "You need more than 1 value for a histogram!" GoTo BeforeExit End If End With 'We expand rInput to the last cell with content Set rInput = Range(rInput, rInput.End(xlDown)) 'Check if all cell values are numeric For Each rCell In rInput If IsNumeric(rCell.Value) = False Then MsgBox "The value in cell " & rCell.Address & _ " is not numeric." rCell.Select GoTo BeforeExit End If Next On Error GoTo ErrorHandle Application.ScreenUpdating = False 'Copy the input values to an array. Used at the end to 're-insert the values in the original sequence. arBackup = rInput.Value 'Find average/mean value dAvg = WorksheetFunction.Average(rInput) 'Standard deviation dStdev = WorksheetFunction.StDev(rInput) 'Upper limit for lowest interval is 'average - 3 * standard deviation dMin = dAvg - 3 * dStdev 'Upper limit for last/highest interval. Used by the 'loop that puts frequencies into arData. dRangeMax = WorksheetFunction.Max(rInput) + 1 'Interval size = standard deviation dStep = dStdev 'Low limit for the highest interval dMax = dMin + 6 * dStdev 'The intervals with low and high limits are 'saved in the array, arIntervals. The lowest 'interval has no low limit. arIntervals(1, 2) = dMin For lCount = 2 To 8 arIntervals(lCount, 1) = arIntervals(lCount - 1, 2) If lCount < 8 Then arIntervals(lCount, 2) = arIntervals(lCount - 1, 2) + dStep Else 'The highest interval gets a high limit 'equal to the actual highest value + 1. 'This allows us to loop this interval 'just like the others, when we count 'the frequencies. arIntervals(8, 2) = dRangeMax End If Next 'We sort the input values in ascending order to speed 'up the loop that counts frequencies. rInput.Sort Key1:=rInput.Item(1), _ Order1:=xlAscending, Header:=xlGuess, _ OrderCustom:=1, MatchCase:=False, _ Orientation:=xlTopToBottom, _ DataOption1:=xlSortNormal 'The variable lLast is used in the loop below to 'avoid starting from scratch every time. lLast = 1 'We now loop through the input range and count 'the frequencies for each interval. For Each rCell In rInput With rCell For lCount = lLast To 8 'In the lowest interval we just need 'an upper limit. If lCount = 1 Then If .Value < arIntervals(lCount, 2) Then lLast = lCount End If Else 'Interval 2 to 8 If .Value < arIntervals(lCount, 2) _ And .Value >= arIntervals(lCount, 1) Then lLast = lCount Exit For End If End If Next If lCount = 9 Then lCount = 8 arData(lCount) = arData(lCount) + 1 End With Next 'We insert a zero if there is no value. It isn't 'necessary, it just looks better in the table '(in my opinion). For lCount = 1 To 8 If Len(arData(lCount)) = 0 Then arData(lCount) = 0 End If Next 'To make the histogram the macro needs a new table, and 'to avoid conflict with any existing data we insert a 'new sheet for this. Sheets.Add , Worksheets.Item(Sheets.Count) 'Frequency in percent goes to column B, frequency to 'column C and intervals to column A. Set rCell = Range("B2") 'The loop runs from 0 to 7 = 8 times For lCount = 0 To 7 'Frequency for each interval is recalculated to percent With rCell .Offset(lCount).Value = _ arData(lCount + 1) * 100 / rInput.Count 'Frequency .Offset(lCount, 1).Value = arData(lCount + 1) 'Intervals If lCount < 7 Then .Offset(lCount, -1).Value = arIntervals(lCount + 1, 2) Else .Offset(lCount, -1).Value = "More" End If End With Next 'Headers Range("A1").Value = "Intervals" Range("B1").Value = "Percent" Range("C1").Value = "Frequency" Range("A1:B8").NumberFormat = "#0.00" 'Autoadjust the width of column A Columns("A:A").EntireColumn.AutoFit 'Now it is time to make the bell shaped curve with 'normal distribution. 'To do this we generate 2000 random numbers with 'the same average value and standard deviation as 'the values for the histogram. We "outsource" this 'task to the procedure, "RandomNumbers". Then it 'is easier to find and use the code for other 'purposes. You can see the procedure below this one. RandomNumbers dAvg, dStdev 'The 2000 values are now in cell M1 and down. Set rBell = Range("M1") Set rBell = Range(rBell, rBell.End(xlDown)) 'We sort the input values to speed up the 'loop that counts frequencies. rBell.Sort Key1:=rBell.Item(1), _ Order1:=xlAscending, Header:=xlGuess, _ OrderCustom:=1, MatchCase:=False, _ Orientation:=xlTopToBottom, _ DataOption1:=xlSortNormal 'Remove old values from arData For lCount = 1 To 8 arData(lCount) = 0 Next lLast = 1 'Now we loop through the 2000 numbers and 'count frequencies. For Each rCell In rBell With rCell For lCount = lLast To 8 If lCount = 1 Then If .Value < arIntervals(lCount, 2) Then lLast = lCount Exit For End If Else If .Value < arIntervals(lCount, 2) _ And .Value >= arIntervals(lCount, 1) Then lLast = lCount Exit For End If End If Next If lCount = 9 Then lCount = 8 arData(lCount) = arData(lCount) + 1 End With Next Set rCell = Range("e2") 'Time to put the frequencies into the table. 'The loop runs from 0 to 7 = 8 times. For lCount = 0 To 7 With rCell 'Frequency .Offset(lCount, 0).Value = arData(lCount + 1) 'Intervals If lCount < 7 Then .Offset(lCount, -1).Value = arIntervals(lCount + 1, 2) Else .Offset(lCount, -1).Value = "More" End If End With Next 'The only thing left to do is to make the chart. 'We leave that to the procedure "MakeChart" (see below). MakeChart BeforeExit: On Error Resume Next 'Insert the input values in the original order rInput.Value = arBackup 'Delete ranges and arrays to avoid memory leak Set rBell = Nothing Set rCell = Nothing Set rInput = Nothing Erase arData Erase arBackup Erase arIntervals 'Screen updating back on Application.ScreenUpdating = True Exit Sub ErrorHandle: 'This is where we end if an error occurs MsgBox Err.Description & " Procedure Histogram2" Resume BeforeExit End Sub '************************** Sub RandomNumbers(ByVal dAvg As Double, ByVal dStdev As Double) 'Generates 2000 random numbers with normal 'distribution and with the same standard 'deviation and average as the input values 'for the histogram. 'The trick to the standard deviation and average 'stuff is to use the worksheet function "NormInv" 'in combination with VBA's random number generator. 'It is easier to use than to explain the math 'behind NormInv - look it up! 'The 2000 numbers are put in cell M1 and down. Dim lCount As Long Dim dRandom As Double Randomize For lCount = 0 To 1999 dRandom = WorksheetFunction.NormInv(Rnd(), dAvg, dStdev) Range("M1").Offset(lCount, 0).Value = dRandom Next End Sub '************************** Sub MakeChart() 'Makes the chart with the histogram and 'the bell shaped curve. 'I have just used the macro recorder and 'adjusted the code a bit. Feel free to 'do it in a smarter way - I am sure that 'is possible, but this works fine for me. Dim sSheet As String On Error GoTo ErrorHandle sSheet = ActiveSheet.Name Range("A1:A9,C1:C9,E1:E9").Select Charts.Add ActiveChart.ChartType = xlXYScatterSmoothNoMarkers ActiveChart.SetSourceData Source:= _ Sheets(sSheet).Range("A1:A9,C1:C9,E1:E9") ActiveChart.Location Where:=xlLocationAsObject, Name:=sSheet ActiveChart.SeriesCollection(1).AxisGroup = 2 ActiveChart.SeriesCollection(1).ChartType = xlColumnClustered ActiveChart.SeriesCollection(1).Select With ActiveChart.ChartGroups(1) .Overlap = 0 .GapWidth = 0 .HasSeriesLines = False .VaryByCategories = False End With ActiveChart.PlotArea.Select With Selection.Border .ColorIndex = 16 .Weight = xlThin .LineStyle = xlContinuous End With With Selection.Interior .ColorIndex = 2 .PatternColorIndex = 1 .Pattern = xlSolid End With ActiveChart.SeriesCollection(2).Select With Selection.Border .ColorIndex = 57 .Weight = xlThick .LineStyle = xlContinuous End With With Selection .MarkerBackgroundColorIndex = xlNone .MarkerForegroundColorIndex = xlNone .MarkerStyle = xlNone .Smooth = True .MarkerSize = 3 .Shadow = False End With ActiveChart.Legend.Delete Exit Sub ErrorHandle: MsgBox Err.Description & " Procedure MakeChart" End Sub That was the first histogram with a bell shaped curve and standard deviation as interval size, just like the example om Microsoft's page, but much easier and without using Analysis Toolpak. Histogram with userdefined number of columnsIn the next example we let the user decide the number of columns (intervals), and the interval size is calculated as: (max value in data set - min value) / number of columns We then count the frequency for each interval and make the histogram as a simple columns chart. To identify the workbook with source data for the histogram we use the same OpenForm procedure as above, so I'll not repeat that. Sub Simple() 'The start procedure that first calls the 'procedure "OpenForm" and then "Histogram". 'bAbort is a Boolean declared on module level. bBell = False OpenForm If bAbort Then bAbort = False Exit Sub End If End Sub '*********************** Sub Histogram() 'Makes a "simple" histogram. The user 'defines the number of columns (intervals), 'and the interval size is calculated as: '(highest value - lowest value) / number of columns Dim bOK As Boolean Dim rCell As Range 'Range variable Dim rInput As Range 'Range variable Dim dMax As Double 'Highest value Dim dMin As Double 'Lowest value Dim dStep As Double 'Interval size Dim lCount As Long 'Counter Dim lLast As Long 'Counter Dim sInterval As String 'String variable Dim arData() 'Array Dim arBackup() 'Array Dim vInput 'Number of columns Dim sSheet As String 'Sheet name On Error Resume Next 'Now the user must select the first cell 'with a value for the histogram. The range 'variable, rInput, is set = the selected cell. Set rInput = Application.InputBox(prompt:= _ "Select the first cell with a value in the " & _ "column with values for the histogram.", Type:=8) 'If the user cancelled If rInput Is Nothing Then Exit Sub On Error GoTo ErrorHandle 'Check: With rInput 'If more than 1 cell selected If .Count > 1 Then MsgBox "Select only 1 cell." ThisWorkbook.Activate GoTo BeforeExit End If 'Check if the cell is empty If Len(.Value) = 0 Then MsgBox "The cell is empty." GoTo BeforeExit End If 'Is it a number? If IsNumeric(.Value) = False Then If IsNumeric(.Offset(1, 0)) = False Then MsgBox "It must be a number" ThisWorkbook.Activate GoTo BeforeExit Else 'If the selected cell isn't numeric, 'but the one below is, the user 'probably selected the header, 'so we set rInput = the cell below. Set rInput = rInput.Offset(1, 0) End If End If 'Are there more than 1 cell with values 'in the column? If IsEmpty(.Offset(1, 0)) Then MsgBox "You need more than 1 value for a histogram." GoTo BeforeExit End If End With 'We now extend rInput to the last cell 'with a content. Set rInput = Range(rInput, rInput.End(xlDown)) 'Check if all values are numeric For Each rCell In rInput If IsNumeric(rCell.Value) = False Then MsgBox "The value in cell " & rCell.Address & _ " isn't numeric." rCell.Select GoTo BeforeExit End If Next 'The program needs to know the number of columns '(intervals), and the following loop will loop 'until the inserted value is okay, or the user 'clicks Cancel. Do Until bOK vInput = InputBox("How many columns/intervals " & _ "do you want in the histogram?", "Number of columns") 'If the user cancelled If vInput = vbCancel Then ThisWorkbook.Activate GoTo BeforeExit 'If no input or not a number ElseIf Len(vInput) = 0 Or IsNumeric(vInput) = False Then MsgBox "It must be a number" 'Less than 3 columns makes no sense ElseIf vInput < 3 Then MsgBox vInput & " columns makes no sense for a histogram." 'More columns than values doesn't work either ElseIf vInput > rInput.Count Then MsgBox "You can't have more columns than values" Else bOK = True End If Loop On Error GoTo ErrorHandle 'Switch off screen updating for speed Application.ScreenUpdating = False 'Redimension the array arData to number of columns ReDim arData(1 To vInput) 'We copy the source values to an array. At the end 'it is used to put back the values in the original 'order. arBackup = rInput.Value 'Highest value in the range dMax = WorksheetFunction.Max(rInput) 'Lowest value dMin = WorksheetFunction.Min(rInput) 'Now we calculate the interval size, i.e. the 'difference between each interval. dStep = (dMax - dMin) / vInput 'Soon we will loop through the cells to find the 'frequencies, and to speed up this process we 'sort the range in ascending order. Before we exit the 'procedure, we will use our backup array to restore 'the original sequence. rInput.Sort Key1:=rInput.Item(1), _ Order1:=xlAscending, Header:=xlGuess, _ OrderCustom:=1, MatchCase:=False, _ Orientation:=xlTopToBottom, _ DataOption1:=xlSortNormal 'The variable lLast is used by the loop below 'to avoid unnecessary loops and gets a start 'value of 2. lLast = 2 'We now loop through the range and count how many 'cell values are in the different intervals. For Each rCell In rInput With rCell 'If the cell value is less than lowest value + 'the interval size, it belongs to the first '(lowest) interval. If .Value < dMin + dStep Then lCount = 1 Else 'Else it belongs to a higher interval, and 'we loop through the remaining intervals 'starting with the one we used last. For lCount = lLast To vInput 'When we have found the right interval, we 'leave the loop. It was to speed up this 'process that we sorted the range in 'ascending order. If .Value < dMin + dStep * lCount Then 'lLast is set = lCount, so we don't 'start from scratch the next time. lLast = lCount Exit For End If Next End If 'When we reach the last cell in the range, 'lCount will get a value of number of columns '+ 1. That would trigger an error when we 'address our array, so we subtract 1. If lCount = vInput + 1 Then lCount = vInput '1 is added to the current interval. arData(lCount) = arData(lCount) + 1 End With Next 'We now find the lower and upper value of each interval. 'We use these for our x-axis. Delete this code or 'rewrite it if you want something else. 'To make the histogram the macro must insert a new 'table, and to avoid any fuss about deleting existing 'data, we put the table in a new sheet. Sheets.Add , Worksheets.Item(Sheets.Count) 'Intervals are inserted in cell A2 and down, frequencies 'are recalculated to percent and inserted in cell B2 and 'down. The frequencies are added to column C. 'Of course this can be changed, or you can prompt 'the user for a range. Set rCell = Range("B2") 'We loop from 0 to number of columns -1. There are 'several ways - the important thing is the offset 'to the start cell. For lCount = 0 To vInput - 1 'Frequency for each interval is recalculated to percent 'and inserted with 2 decimals. rCell.Offset(lCount).Value = _ Round(arData(lCount + 1) * 100 / rInput.Count, 2) 'If it isn't the last interval If lCount + 1 < UBound(arData) Then 'The interval is put into a string variable sInterval = Str(Round(dMin + dStep * lCount, 2)) & _ "-" & Str(Round(dMin + dStep * (lCount + 1) - 0.01, 2)) 'Frequency rCell.Offset(lCount, 1).Value = arData(lCount + 1) Else 'If it is the max value = last interval sInterval = Str(Round(dMin + dStep * lCount, 2)) & _ "-" & Str(Round(dMax, 2)) 'Frequncy rCell.Offset(lCount, 1).Value = arData(lCount + 1) End If 'The interval is inserted in the column to the left of 'the values (%). rCell.Offset(lCount, -1).Value = sInterval Next 'Headers Range("A1").Value = "Intervals" Range("B1").Value = "Percent" Range("C1").Value = "Frequency" 'Now we insert average, standard deviation, max and min. 'We don't use this, it is just an example on how to 'use worksheet functions in VBA. Range("E1").Value = "Average" Range("E2").Value = "Standard dev." Range("E3").Value = "Max" Range("E4").Value = "Min" Range("F1").Value = WorksheetFunction.Average(rInput) Range("F2").Value = WorksheetFunction.StDev(rInput) Range("F3").Value = dMax Range("F4").Value = dMin 'Show with 2 decimals Range("F1:F4").NumberFormat = "#0.00" 'Autoadjust the width of column A Columns("A:A").EntireColumn.AutoFit 'The variable sSheet gets the name of the 'active sheet. We use this when making the chart. sSheet = ActiveSheet.Name 'Set rCell = the table Set rCell = Range("A1:B" & vInput + 1) 'Now we make the chart, the histogram. There 'are probably smarter ways - I have just 'modified the macro recorder code slightly. Charts.Add ActiveChart.ChartType = xlColumnClustered ActiveChart.SetSourceData Source:=rCell, PlotBy:= _ xlColumns ActiveChart.Location Where:=xlLocationAsObject, Name:=sSheet With ActiveChart .HasTitle = True .ChartTitle.Characters.Text = "Procent" .Axes(xlCategory, xlPrimary).HasTitle = False .Axes(xlValue, xlPrimary).HasTitle = False .HasLegend = False End With With ActiveChart.ChartGroups(1) .Overlap = 0 .GapWidth = 0 .HasSeriesLines = False .VaryByCategories = False End With BeforeExit: On Error Resume Next 'We insert the source values in the 'original sequence. rInput.Value = arBackup 'Ranges and arrays are deleted to avoid memory leak. Set rCell = Nothing Set rInput = Nothing Erase arData Erase arBackup 'Switch on screen updating Application.ScreenUpdating = True Exit Sub ErrorHandle: 'This is where we end if an error occurs MsgBox Err.Description & " Procedure Histogram" Resume BeforeExit End Sub That was it: Two types of histograms. Redo the chart's layout to your liking. |