|
| |
Histogrammer i Excel med VBA-makroer
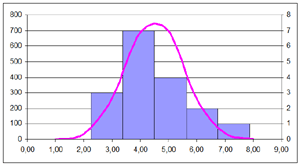
På denne side viser jeg, hvordan man hurtigt og nemt kan lave histogrammer i Excel med lidt VBA-kode (makroer). Jeg viser også, hvordan man kan lave en normalfordelt, klokkeformet kurve over søjlediagrammet. Et histogram viser grafisk hyppigheden af forekomster i et datasæt, enten som frekvenser eller i procent, og man kan visuelt vurdere, om data er normalfordelt. Vil man være sikker på det med normalfordelingen, må man dog lave en statistisk test, men det vil jeg ikke komme ind på - emnet her er VBA og ikke statistik. I Excel kan man lave histogrammer manuelt, hvis man har installeret tilføjelsesprogrammet Analysis ToolPak, men jeg synes, det er bøvlet (se her hvordan), hvis man skal gøre det ofte på datasæt af forskellig størrelse. En makro i VBA er derimod lynhurtig. Jeg viser først, hvordan man kan lave et histogram som i Microsofts eksempel, blot med makroer i stedet. Derefter viser jeg (link), hvordan man ud fra et brugervalgt antal søjler beregner intervalstørrelsen, finder hyppigheden af forekomster i hvert interval, omregner hyppigheden til procent og indsætter det i et histogram. Du kan markere og kopiere koden til et VBA-modul eller downloade et zip-komprimeret regneark med eksemplerne. Regnearket (og koden herunder) antager, at kildedata til histogrammet er i et andet regneark, og histogrammet indsættes på et nyt faneblad i arket med kildedata. Histogram med klokkeformet kurveI det første histogram er antallet af søjler (intervaller) fast, nemlig 8, og intervallernes størrelse beregnes ud fra datasættets standardafvigelse og middelværdi. Til at lave den klokkeformede, normalfordelte kurve bruger vi 2000 "tilfældige" tal med (næsten) samme standardafvigelse og middelværdi. Fidusen til at gøre dette er at bruge regnearksfunktionen "NormInv" sammen med VBA's generator af tilfældige tal. På modulniveau skal du deklarere 2 public variable: Public bAbort as Boolean og Public bBell as Boolean. Sub BellShape() 'Startproceduren, som kalder proceduren '"OpenForm" og dernæst "Histogram2". 'bAbort er en variabel af typen Boolean, 'som er deklareret på modulniveau - altså 'i toppen. bBell = True OpenForm If bAbort Then bAbort = False Exit Sub End If End Sub '*********************** Sub OpenForm() 'Åbner regnearket med kildedata eller 'beder brugeren gøre det. Denne procedure 'bruges uanset om det er den ene 'eller anden histogramtype. On Error GoTo ErrorHandle 'Hvis der kun er ét regneark åbent '(dette), vises fil-åbn dialogen. If Workbooks.Count = 1 Then 'Åbn fil-dialogen With Application.FileDialog(msoFileDialogOpen) .Title = "Åbn ark med data til histogrammet" 'Tillad kun åbning af 1 fil .AllowMultiSelect = False 'Vis filer med extension "xl*" .Filters.Add "Workbooks", "*.xl*", 1 .Show If .SelectedItems.Count > 0 Then Workbooks.Open (.SelectedItems(1)) Else 'Hvis brugeren annullerede bAbort = True Exit Sub End If End With ElseIf Workbooks.Count = 2 Then 'Hvis der er mere end 2 regneark 'åbne, aktiveres det andet. If Workbooks.Item(1).Name = ThisWorkbook.Name Then Workbooks(2).Activate Else Workbooks(1).Activate End If ElseIf Workbooks.Count > 2 Then Workbooks(Workbooks.Count).Activate End If 'Viser en modeless ("flydende") UserForm, som beder 'brugeren aktivere regnearket med kildedata. 'For at se denne userform må du downloade regnearket 'eller lave en selv - den skal bare have en tekst samt 'en OK og en Cancel-knap. frmPickSheet.Show vbModeless Exit Sub ErrorHandle: MsgBox Err.Description & " Procedure OpenForm" End Sub Du skal lave en simpel Userform og kalde den "frmPickSheet". På formularen skal være en label og 2 commaand buttons. På labelen beder du brugeren aktivere fanebladet med kildedata, og formularens kode skal bare være som følger:
Private Sub CommandButton1_Click()
   Unload Me
   If bBell Then
      Module1.Histogram2
   Else
      Module1.Histogram
   End If
End Sub

Private Sub CommandButton2_Click()
Unload Me
End Sub
Så vidt, så godt. Hvis brugeren ikke har annulleret, er regnearket med kildedata nu det aktive ark, og vi kan gå videre. I den næste procedure beder vi brugeren om at vælge den øverste celle/værdi i kolonnen med kildedata. Vi kontrollerer, at data er valide, og hvis alt er OK, laver vi histogrammet. Sub Histogram2() 'Laver et histogram og en klokkeformet normal- 'fordelingskurve. Skaleringsintervallerne er 'baseret på gennemsnit og standardafvigelse. Dim bOK As Boolean Dim dAvg As Double 'Gennemsnit Dim dStdev As Double 'Standardafvigelse Dim dStep As Double 'Intervalstørrelse Dim dMax As Double 'Højeste intervalværdi Dim dRangeMax As Double 'Øvre grænse = fakstisk max +1 Dim dMin As Double 'Laveste værdi Dim lCount As Long 'Tæller Dim lLast As Long '"Hjælpetæller" Dim rCell As Range 'Rangevariabel Dim rInput As Range 'Rangevariabel Dim rBell As Range 'Rangevariabel Dim arData(1 To 8) 'Array til frekvenserne Dim arBackup() 'Array med usorterede værdier Dim arIntervals(1 To 8, 1 To 2) 'Array med intervallerne On Error Resume Next 'Brugeren skal nu udpege den første celle 'i kolonnen med værdier til histogrammet. Set rInput = Application.InputBox _ (prompt:="Markér øverste celle i kolonnen med " & _ "værdier, som skal bruges i histogrammet.", Type:=8) If rInput Is Nothing Then Exit Sub On Error GoTo ErrorHandle 'Kontrol: With rInput 'Hvis der er valgt mere end 1 celle If .Count > 1 Then MsgBox "Der skal kun vælges 1 celle." ThisWorkbook.Activate GoTo BeforeExit End If 'Vi tjekker lige, om cellen er tom If Len(.Value) = 0 Then MsgBox "Cellen er tom." GoTo BeforeExit End If 'Numerisk værdi? If IsNumeric(.Value) = False Then If IsNumeric(.Offset(1, 0)) = False Then MsgBox "Det skal være et tal" ThisWorkbook.Activate GoTo BeforeExit Else 'Hvis cellen under den valgte celle 'er numerisk, har brugeren sikkert 'klikket på kolonneoverskriften, og 'så sætter vi rInput = cellen 'nedenunder. Set rInput = rInput.Offset(1, 0) End If End If 'Er der mere end 1 celle med værdier i kolonnen? If IsEmpty(.Offset(1, 0)) Then MsgBox "Der skal mere end 1 værdi til at lave et histogram!" GoTo BeforeExit End If End With 'rInput udvides nu til sidste celle med 'indhold nedenunder. Set rInput = Range(rInput, rInput.End(xlDown)) 'Vi tjekker om alle værdier er numeriske For Each rCell In rInput If IsNumeric(rCell.Value) = False Then MsgBox "Værdien i celle " & rCell.Address & _ " er ikke numerisk." rCell.Select GoTo BeforeExit End If Next On Error GoTo ErrorHandle 'Slår skærmopdatering fra Application.ScreenUpdating = False 'Vi kopierer værdierne til et array. Bruges til slut til at 'indsætte værdierne i den oprindelige rækkefølge. arBackup = rInput.Value 'Finder middelværdien dAvg = WorksheetFunction.Average(rInput) 'Standardafvigelsen dStdev = WorksheetFunction.StDev(rInput) 'Nedre = gennemsnit - 3 * standardafvigelsen dMin = dAvg - 3 * dStdev 'Øvre værdi for sidste interval. Bruges i 'løkken, som fylder intervaller i arIntervals dRangeMax = WorksheetFunction.Max(rInput) + 1 'Intervalstørrelse = standardafvigelsen dStep = dStdev 'Højeste (nedre) intervalværdi er lig nedre '+ 6 * standardafvigelse dMax = dMin + 6 * dStdev 'Intervallerne med nedre og øvre værdi gemmes i 'arrayet arIntervals. Det nederste interval 'har dog ingen nedre grænse. arIntervals(1, 2) = dMin For lCount = 2 To 8 arIntervals(lCount, 1) = arIntervals(lCount - 1, 2) If lCount < 8 Then arIntervals(lCount, 2) = arIntervals(lCount - 1, 2) + dStep Else 'Ved øverste interval sættes øvre værdi = 'største værdi i inputværdierne + 1. Det 'gøres alene for at kunne behandle øverste 'interval som de øvrige, når frekvenserne 'skal findes. arIntervals(8, 2) = dRangeMax End If Next 'For at speede gennemløbet op sorteres kolonnen med stigende 'værdier. Inden proceduren forlades, indsætter vi 'vores backup med værdierne i den oprindelige rækkefølge. rInput.Sort Key1:=rInput.Item(1), _ Order1:=xlAscending, Header:=xlGuess, _ OrderCustom:=1, MatchCase:=False, _ Orientation:=xlTopToBottom, _ DataOption1:=xlSortNormal 'Variablen lLast bruges i løkken nedenunder til at 'undgå overflødige gennemløb og får startværdien 1. lLast = 1 'Nu gennemløbes området, og vi tæller op, hvor mange 'forekomster (celler) der er i hvert interval. For Each rCell In rInput With rCell For lCount = lLast To 8 'I nederste interval skal der kun være 'en øvre værdi. If lCount = 1 Then If .Value < arIntervals(lCount, 2) Then lLast = lCount End If Else 'Interval 2 til 8 If .Value < arIntervals(lCount, 2) _ And .Value >= arIntervals(lCount, 1) Then lLast = lCount Exit For End If End If Next If lCount = 9 Then lCount = 8 arData(lCount) = arData(lCount) + 1 End With Next 'Indsætter nul hvis ingen forekomst. Det er ikke 'nødvendigt, men ser bedre ud i tabellen. For lCount = 1 To 8 If Len(arData(lCount)) = 0 Then arData(lCount) = 0 End If Next 'Makroen skal indsætte en ny tabel, og for at undgå bøvl 'med overskrivning af eksisterende data, indsætter vi 'tabellen på et nyt faneblad. Det kan naturligvis ændres. Sheets.Add , Worksheets.Item(Sheets.Count) 'Her indsættes hyppigheden i % i cellen B2 og ned 'og intervallerne i kolonne "A". Frekvensen indsættes i kolonne C. 'Det kan du naturligvis også ændre. Evt. kan du bede brugeren 'udpege indsætningspunktet, helt analogt med koden i starten af 'denne procedure, hvor brugeren skulle vælge startværdien. Set rCell = Range("B2") 'Løkken kører fra 0 til 7 = 8 gange For lCount = 0 To 7 'Antal forekomster i hvert interval omregnes til procent af 'antallet af celler i området. With rCell .Offset(lCount).Value = _ arData(lCount + 1) * 100 / rInput.Count 'Frekvens .Offset(lCount, 1).Value = arData(lCount + 1) 'Intervallerne indsættes i kolonnen til venstre for værdierne If lCount < 7 Then .Offset(lCount, -1).Value = arIntervals(lCount + 1, 2) Else .Offset(lCount, -1).Value = "Mere" End If End With Next 'Overskrifter Range("A1").Value = "Intervaller" Range("B1").Value = "Procent" Range("C1").Value = "Frekvens" 'Nu indsættes gennemsnit, standardafvigelse, max og min. 'Det er bare eksempler på, at man kan bruge 'regnearksfunktioner i VBA, og kan evt. slettes. Range("f1").Value = "Snit" Range("f2").Value = "Stdafv." Range("f3").Value = "Max" Range("f4").Value = "Min" Range("g1").Value = WorksheetFunction.Average(rInput) Range("g2").Value = WorksheetFunction.StDev(rInput) Range("g3").Value = dMax Range("g4").Value = dMin Range("g1:g4").NumberFormat = "#0.00" Range("A1:B8").NumberFormat = "#0.00" 'Justerer bredden kolonne A Columns("A:A").EntireColumn.AutoFit 'Nu skal vi lave den klokkeformede, normalfordelte 'kurve. Til dette genereres 2000 tilfældige tal med 'samme middelværdi og standardafvigelse som input- 'værdierne til histogrammet. Vi uddelegerer opgaven 'til proceduren "RandomNumbers" - så er det nemmere 'at genbruge koden i andre sammenhænge. 'Du kan se proceduren længere nede på siden. RandomNumbers dAvg, dStdev 'De 2000 værdier er nu indsat i celle M1 og ned Set rBell = Range("M1") Set rBell = Range(rBell, rBell.End(xlDown)) 'For at speede gennemløbet op sorteres kolonnen med stigende 'værdier. rBell.Sort Key1:=rBell.Item(1), _ Order1:=xlAscending, Header:=xlGuess, _ OrderCustom:=1, MatchCase:=False, _ Orientation:=xlTopToBottom, _ DataOption1:=xlSortNormal For lCount = 1 To 8 arData(lCount) = 0 Next lLast = 1 'Nu gennemløbes området, og vi tæller op, hvor mange 'forekomster (celler) der er i hvert interval. For Each rCell In rBell With rCell For lCount = lLast To 8 If lCount = 1 Then If .Value < arIntervals(lCount, 2) Then lLast = lCount Exit For End If Else If .Value < arIntervals(lCount, 2) _ And .Value >= arIntervals(lCount, 1) Then lLast = lCount Exit For End If End If Next If lCount = 9 Then lCount = 8 arData(lCount) = arData(lCount) + 1 End With Next Set rCell = Range("e2") 'Løkken kører fra 0 til 7 = 8 gange For lCount = 0 To 7 With rCell 'Frekvens .Offset(lCount, 0).Value = arData(lCount + 1) 'Intervallerne indsættes i kolonnen til venstre for værdierne If lCount < 7 Then .Offset(lCount, -1).Value = arIntervals(lCount + 1, 2) Else .Offset(lCount, -1).Value = "Mere" End If End With Next 'Nu skal vi lave diagrammet - histogrammet. 'Det er uddelegeret til proceduren MakeChart '(se længere nede). MakeChart BeforeExit: On Error Resume Next 'Vi genindsætter værdierne i kolonne A 'i den oprindelige rækkefølge. rInput.Value = arBackup 'Ranges og arrays slettes for at undgå memory leak. Set rBell = Nothing Set rCell = Nothing Set rInput = Nothing Erase arData Erase arBackup Erase arIntervals 'Skærmopdatering slås til igen. Application.ScreenUpdating = True Exit Sub ErrorHandle: 'Her havner vi ved fejl MsgBox Err.Description Resume BeforeExit End Sub '******************** Sub RandomNumbers(ByVal dAvg As Double, ByVal dStdev As Double) 'Genererer 2000 tilfældige, normalfordelte tal 'med samme standardafvigelse og middelværdi 'som inputværdierne til histogrammet. Fidusen 'til det med standardafvigelsen og middelværdien 'er at bruge regnearksfunktionen "NormInv". Den 'er nem at bruge, sværere at forklare - slå selv op! 'Tallene indsættes fra celle M1 og ned. Dim lCount As Long Dim dRandom As Double Randomize For lCount = 0 To 1999 dRandom = WorksheetFunction.NormInv(Rnd(), dAvg, dStdev) Range("M1").Offset(lCount, 0).Value = dRandom Next End Sub '******************** Sub MakeChart() 'Laver histogrammet med den klokkeformede 'og normalfordelte kurve. Jeg har bare 'brugt makrooptageren og efterfølgende 'ændret lidt i koden. Det kan sikkert 'gøres smartere, men det virker for mig. Dim sSheet As String On Error GoTo ErrorHandle 'Indlæser det aktive faneblads navn 'i variablen sSheet sSheet = ActiveSheet.Name Range("A1:A9,C1:C9,E1:E9").Select Charts.Add ActiveChart.ChartType = xlXYScatterSmoothNoMarkers ActiveChart.SetSourceData Source:= _ Sheets(sSheet).Range("A1:A9,C1:C9,E1:E9") ActiveChart.Location Where:=xlLocationAsObject, Name:=sSheet ActiveChart.SeriesCollection(1).AxisGroup = 2 ActiveChart.SeriesCollection(1).ChartType = xlColumnClustered ActiveChart.SeriesCollection(1).Select With ActiveChart.ChartGroups(1) .Overlap = 0 .GapWidth = 0 .HasSeriesLines = False .VaryByCategories = False End With ActiveChart.PlotArea.Select With Selection.Border .ColorIndex = 16 .Weight = xlThin .LineStyle = xlContinuous End With With Selection.Interior .ColorIndex = 2 .PatternColorIndex = 1 .Pattern = xlSolid End With ActiveChart.SeriesCollection(2).Select With Selection.Border .ColorIndex = 57 .Weight = xlThick .LineStyle = xlContinuous End With With Selection .MarkerBackgroundColorIndex = xlNone .MarkerForegroundColorIndex = xlNone .MarkerStyle = xlNone .Smooth = True .MarkerSize = 3 .Shadow = False End With ActiveChart.Legend.Delete Exit Sub ErrorHandle: MsgBox Err.Description & " Procedure MakeChart" End Sub Det var det første histogram med klokkeformet kurve ovenover, ganske som i eksemplet på Microsofts supportside, men uden manuelt og besværligt fnidder og uden brug af tilføjelsesprogrammet Analysis ToolPak. Histogram med brugervalgt antal søjlerI eksemplet ovenover opererede vi med et fast antal søjler, og som intervalstørrelse brugte vi datasættets standardafvigelse. I eksemplet herunder lader vi brugeren bestemme antallet af søjler (intervaller), og intervalstørrelsen beregnes som: (største værdi i datasættet - mindste værdi) / antal søjler Derefter finder vi hyppigheden i hvert interval og laver histogrammet som et simpelt søjlediagram. Til at identificere regnearket med kildedata bruges samme OpenForm-procedure som ovenfor, så den viser jeg ikke igen. Sub Simple() 'Startproceduren, som først kalder proceduren '"OpenForm" og dernæst "Histogram". 'bAbort er deklareret på modulniveau. bBell = False OpenForm If bAbort Then bAbort = False Exit Sub End If End Sub '****************** Sub Histogram() 'Laver et "simpelt" histogram. Antallet af 'søjler (intervaller) er brugerdefineret og 'intervalstørrelsen beregnes som: '(højeste værdi - mindste værdi) / antal søjler Dim bOK As Boolean Dim rCell As Range 'Rangevariabel Dim rInput As Range 'Rangevariabel Dim dMax As Double 'Højeste værdi Dim dMin As Double 'Laveste værdi Dim dStep As Double 'Intervalstørrelse Dim lCount As Long 'Tæller Dim lLast As Long '"Hjælpetæller" Dim sInterval As String 'Strengvariabel Dim arData() 'Array Dim arBackup() 'Array Dim vInput 'Brugerbestemte antal søjler Dim sSheet As String 'Navn på faneblad On Error Resume Next 'Brugeren skal nu udpege den første celle 'i kolonnen med værdier til histogrammet. 'Rangevariablen rInput sættes = den celle, 'brugeren vælger. Set rInput = Application.InputBox(prompt:= _ "Markér øverste celle i kolonnen med " & _ "værdier, som skal bruges i histogrammet.", Type:=8) 'Hvis brugeren annullerede If rInput Is Nothing Then Exit Sub On Error GoTo ErrorHandle 'Kontrol: With rInput 'Hvis der er valgt mere end 1 celle If .Count > 1 Then MsgBox "Der skal kun vælges 1 celle." ThisWorkbook.Activate GoTo BeforeExit End If 'Vi tjekker, om cellen er tom If Len(.Value) = 0 Then MsgBox "Cellen er tom." GoTo BeforeExit End If 'Numerisk værdi? If IsNumeric(.Value) = False Then If IsNumeric(.Offset(1, 0)) = False Then MsgBox "Det skal være et tal" ThisWorkbook.Activate GoTo BeforeExit Else 'Hvis cellen under den valgte celle 'er numerisk, har brugeren sikkert 'klikket på kolonneoverskriften, og 'så sætter vi rInput = cellen 'nedenunder. Set rInput = rInput.Offset(1, 0) End If End If 'Er der mere end 1 celle med værdier 'i kolonnen? If IsEmpty(.Offset(1, 0)) Then MsgBox "Der skal mere end 1 værdi til at lave et histogram." GoTo BeforeExit End If End With 'rInput udvides nu til sidste celle med 'indhold nedenunder. Set rInput = Range(rInput, rInput.End(xlDown)) 'Vi tjekker om alle værdier er numeriske For Each rCell In rInput If IsNumeric(rCell.Value) = False Then MsgBox "Værdien i celle " & rCell.Address & _ " er ikke numerisk." rCell.Select GoTo BeforeExit End If Next 'Programmet skal lave intervallerne og skal vide, 'hvor mange der skal være. 'Løkken kører, til den indtastede værdi er OK, 'eller brugeren annullerer. Do Until bOK vInput = InputBox("Hvor mange søjler/intervaller " & _ "skal der være i histogrammet?", "Antal søjler") 'Hvis brugeren annullerer If vInput = vbCancel Then ThisWorkbook.Activate GoTo BeforeExit 'Hvis der ikke er skrevet noget, eller hvis det ikke 'er et tal. ElseIf Len(vInput) = 0 Or IsNumeric(vInput) = False Then MsgBox "Antal søjler skal være et tal" 'Antal søjler under 3 giver ingen mening ElseIf vInput < 3 Then MsgBox vInput & " søjler giver ingen mening til et histogram." 'Flere søjler end værdier giver heller ingen mening ElseIf vInput > rInput.Count Then MsgBox "Der er flere intervaller end værdier" Else bOK = True End If Loop On Error GoTo ErrorHandle 'Slår skærmopdatering fra Application.ScreenUpdating = False 'Redimensionerer arrayet arData til antal søjler ReDim arData(1 To vInput) 'Vi kopierer værdierne til et array. Bruges til slut til at 'indsætte værdierne i den oprindelige rækkefølge. arBackup = rInput.Value 'Højeste værdi i området dMax = WorksheetFunction.Max(rInput) 'Laveste værdi dMin = WorksheetFunction.Min(rInput) 'Nu findes intervalstørrelsen, dvs. forskellen mellem 'hvert interval. Antal intervaller er = det 'brugerdefinerede antal søjler. dStep = (dMax - dMin) / vInput 'For at speede gennemløbet op sorteres kolonnen med stigende 'værdier. Inden proceduren forlades, indsætter vi 'vores backup med værdierne i den oprindelige rækkefølge. rInput.Sort Key1:=rInput.Item(1), _ Order1:=xlAscending, Header:=xlGuess, _ OrderCustom:=1, MatchCase:=False, _ Orientation:=xlTopToBottom, _ DataOption1:=xlSortNormal 'Variablen lLast bruges i løkken nedenunder til at 'undgå overflødige gennemløb og får startværdien 2. lLast = 2 'Nu gennemløbes området, og vi tæller op, hvor mange 'forekomster (celler) der er i hvert interval. For Each rCell In rInput With rCell 'Hvis cellens værdi er mindre end mindste værdi + 'intervalstørrelse, tilhører den det 'laveste interval. If .Value < dMin + dStep Then lCount = 1 Else 'Ellers tilhører den et højere interval, så 'vi gennemløber intervallerne startende med 'det sidst brugte. For lCount = lLast To vInput 'Når vi har fundet det rette interval, forlades 'løkken. Det var for at speede denne proces op, 'at vi sorterede kolonnen fra laveste til højeste. If .Value < dMin + dStep * lCount Then 'lLast sættes = lCount så vi ikke starter 'forfra næste gang. lLast = lCount Exit For End If Next End If 'Ved sidste celle i løkken får lCount en værdi, 'som er antal søjler + 1, og det ville give en fejl, 'når vi adresserer vores array. If lCount = vInput + 1 Then lCount = vInput 'Der tælles op med 1 i det pågældende interval, så 'vi får frekvensen = antal forekomster. arData(lCount) = arData(lCount) + 1 End With Next 'Nu findes nedre og øvre værdi for hvert interval. Dem kan 'man bruge som værdier på x-aksen. Slet det eller lav det 'om, hvis du vil have noget andet. 'Makroen skal indsætte en ny tabel, og for at undgå bøvl 'med overskrivning af eksisterende data, indsætter vi 'tabellen på et nyt faneblad, som indsættes efter det 'sidste faneblad i regnearkets collection af faneblade. Sheets.Add , Worksheets.Item(Sheets.Count) 'Nu indsættes intervallerne i celle A2 og ned, frekvenserne 'omregnes til procent og indsættes i celle B2 og ned, og 'frekvens indsættes i celle C2 og ned. 'Det kan du naturligvis ændre. Evt. kan du bede 'brugeren udpege indsætningspunktet, helt analogt med 'koden i starten af denne procedure, hvor brugeren skulle 'vælge startcellen for inputværdierne. Set rCell = Range("B2") 'Løkken kører fra 0 til antal søjler -1. Det kan gøres på 'flere måder, man skal bare have styr på udgangscellens 'offset-værdi. For lCount = 0 To vInput - 1 'Antal forekomster i hvert interval omregnes til procent af 'af frekvensen, og tallet afrundes til 2 decimaler. rCell.Offset(lCount).Value = _ Round(arData(lCount + 1) * 100 / rInput.Count, 2) 'Hvis det ikke er sidste interval If lCount + 1 < UBound(arData) Then 'Intervallet puttes i en strengvariabel sInterval = Str(Round(dMin + dStep * lCount, 2)) & _ "-" & Str(Round(dMin + dStep * (lCount + 1) - 0.01, 2)) 'Frekvens rCell.Offset(lCount, 1).Value = arData(lCount + 1) Else 'Hvis det er maxværdien = sidste interval sInterval = Str(Round(dMin + dStep * lCount, 2)) & _ "-" & Str(Round(dMax, 2)) 'Frekvens rCell.Offset(lCount, 1).Value = arData(lCount + 1) End If 'Intervallet indsættes i kolonnen til venstre for værdierne rCell.Offset(lCount, -1).Value = sInterval Next 'Overskrifter Range("A1").Value = "Intervaller" Range("B1").Value = "Procent" Range("C1").Value = "Frekvens" 'Nu indsættes gennemsnit, standardafvigelse, max og min. 'Det er bare eksempler på, at man kan bruge 'regnearksfunktioner i VBA, og kan bare slettes. Range("E1").Value = "Snit" Range("E2").Value = "Stdafv." Range("E3").Value = "Max" Range("E4").Value = "Min" Range("F1").Value = WorksheetFunction.Average(rInput) Range("F2").Value = WorksheetFunction.StDev(rInput) Range("F3").Value = dMax Range("F4").Value = dMin 'Vis med 2 decimaler Range("F1:F4").NumberFormat = "#0.00" 'Justerer bredden af kolonne A Columns("A:A").EntireColumn.AutoFit 'Indlæser det aktive faneblads navn 'i variablen sSheet sSheet = ActiveSheet.Name 'Sætter rCell = diagrammets tabel Set rCell = Range("A1:B" & vInput + 1) 'Nu indsættes et søjlediagram - histogrammet. 'Det kan sikkert gøres smartere - jeg har 'bare modificeret makrooptagerens kode. Charts.Add ActiveChart.ChartType = xlColumnClustered ActiveChart.SetSourceData Source:=rCell, PlotBy:= _ xlColumns ActiveChart.Location Where:=xlLocationAsObject, Name:=sSheet With ActiveChart .HasTitle = True .ChartTitle.Characters.Text = "Procent" .Axes(xlCategory, xlPrimary).HasTitle = False .Axes(xlValue, xlPrimary).HasTitle = False .HasLegend = False End With With ActiveChart.ChartGroups(1) .Overlap = 0 .GapWidth = 0 .HasSeriesLines = False .VaryByCategories = False End With BeforeExit: On Error Resume Next 'Vi genindsætter værdierne i kolonne A 'i den oprindelige rækkefølge. rInput.Value = arBackup 'Ranges og arrays slettes for at undgå memory leak. Set rCell = Nothing Set rInput = Nothing Erase arData Erase arBackup 'Skærmopdatering slås til igen. Application.ScreenUpdating = True Exit Sub ErrorHandle: 'Her havner vi ved fejl MsgBox Err.Description & " Procedure Histogram" Resume BeforeExit End Sub Det var det: To typer histogram med VBA makroer. |